Recession Update – July 10, 2023
Author: Joe Maas, CIO, SPG Advisors, LLC
Published July 10, 2023
Recession Indicators Key:
- Below average economic conditions
- Average current economic conditions
- Above average economic conditions
Recession Indicators Summary: (click on each item for references)
- ISM Manufacturing Index
- ISM Services Index
- Philadelphia Fed Aurora Diebold Scotti Business Conditions Index (ADS)
- Philadelphia Fed Business Outlook Survey (BOS)
- Anxious Index
- The Conference Board U.S Leading Economic Indicators Index
- The Conference Board Employment Trends Index (ETI)
- Chicago Fed National Activity Index (CFNAI)
Consensus: Looking across a variety of leading, lagging, and current economic indicators, an economic slowdown or recessionary period, of some magnitude is likely in the coming months.
Recession Definition: Broadbase, Persistent Decline in Economic Activity
ISM Manufacturing Index
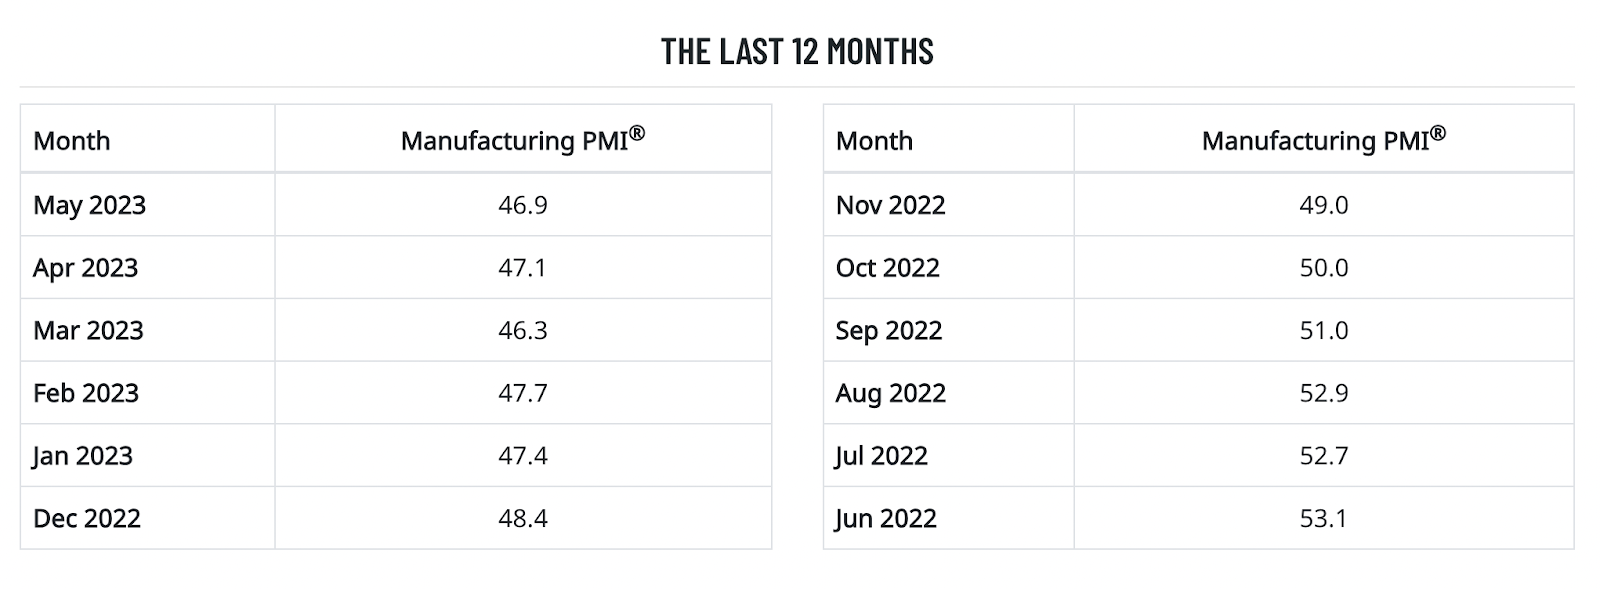
Significance: The ISM Manufacturing Index, or the purchasing manager’s index, tracks US economic activity in the manufacturing sector, based on a survey of 300+ manufacturers. Readings above 50% demonstrate expansion, while readings below 50% demonstrate contraction in the manufacturing industry.
Frequency: Monthly
Current State of Index: The most recent ISM Manufacturing PMI for the month of May posted at a cooler than expected 46.9%, down from April’s 47.1%. As manufacturing nears its seventh consecutive month of contractionary PMIs, the industry is still seeing mixed areas of contraction, however leading indicators such as new orders have brought manufacturing indexes lower. Overall, the near term outlook for the manufacturing industry is becoming bleaker each month as the ISM PMI points to slipping demand.
ISM Services Index
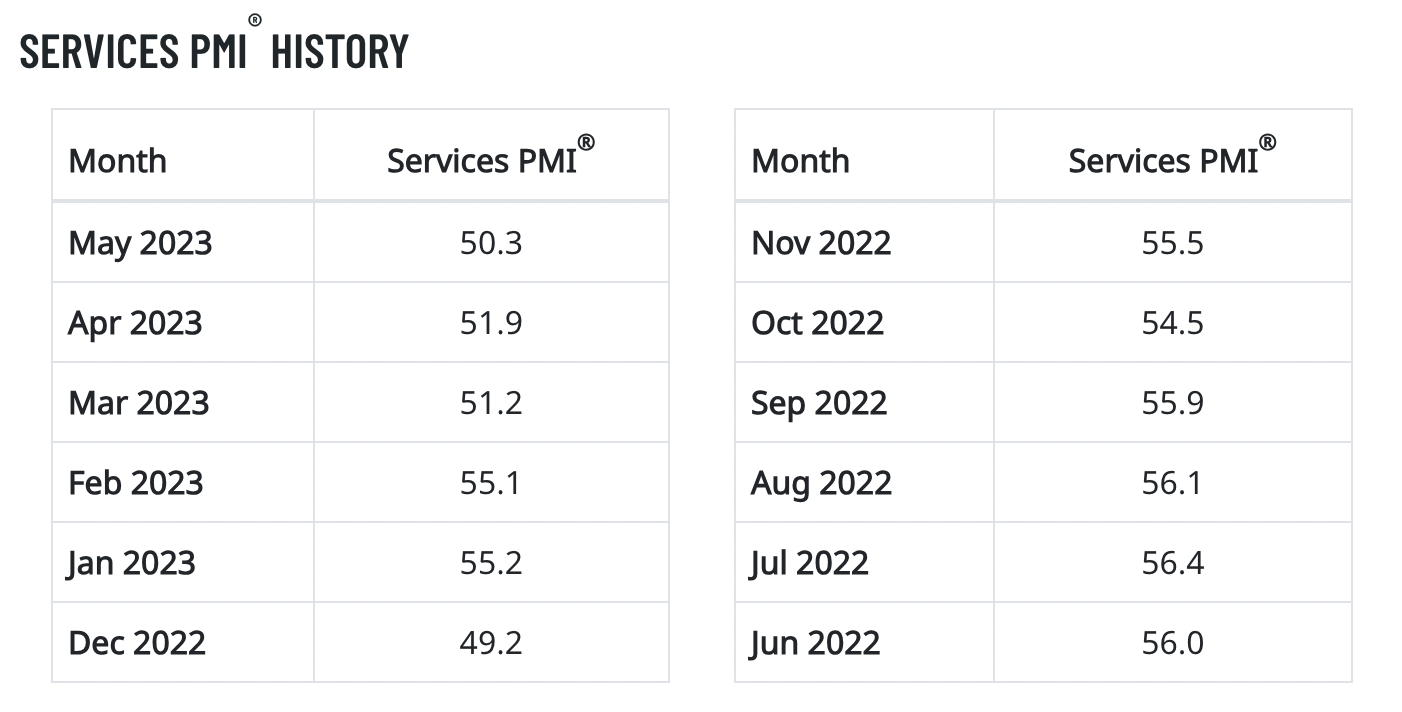
Significance: Slightly younger than the ISM Manufacturing Index, the ISM Services Index, or the non-manufacturing index, tracks US economic activity in the services sector, based on a survey of 400+ services firms. Readings above 50% demonstrate economic expansion, while readings below 50% demonstrate contraction in the services industry at large.
Frequency: Monthly
Current State of Index: May’s ISM Services PMI remained neutral at 50.3%, however this amounted to a sizable 1.6% decline from April’s reading. Although this most recent data is neutral, the trend over the last twelve months is not bullish by any means. The ISM services employment index came in at a slightly bearish 49.1%, following many months of a hot job market in service industries. Overall, the service side of the economy is stable, for now, but we will continue to closely monitor for any changes.
Philadelphia Fed’s Aurora Diebold Scotti Business Conditions Index (ADS)
Significance: The ADS index is a lagging index of typical business cycle indicators including: initial jobless claims, monthly payroll employment, monthly industrial production, monthly real personal income less transfer payments, monthly real manufacturing & trade sales, and quarterly real GDP. The index has an average value of 0, with positive readings indicating ideal business conditions and negative readings indicating non-ideal business conditions.
Frequency: Weekly
Current State of Index: As of June 22nd, the ADS Business Conditions index sat -0.12, and has been negative since early May. Although the trend of the last month or two appears negative, serious economic downturn have hosted ADS indexes of less than -1, something this index has not seen since the pandemic, therefore it is still providing a neutral recessionary reading.

Philadelphia Fed’s Business Outlook Survey (BOS)
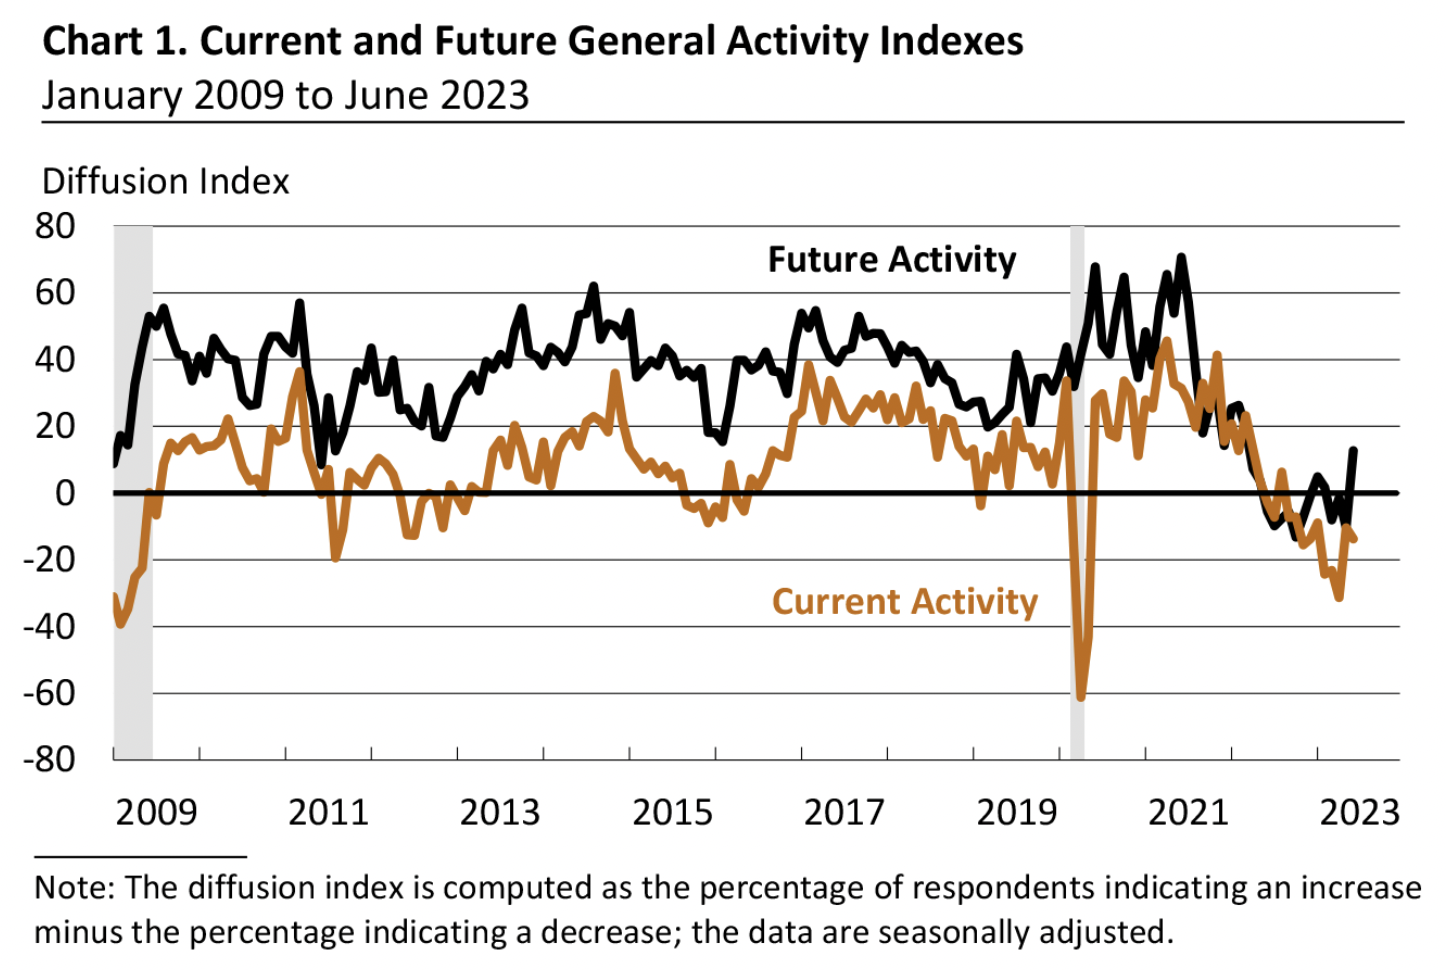
Significance: Philly Fed’s BOS indicator surveys manufacturers in the Third Federal Reserve district of the Philly area. It asks many questions about overall business activity in manufacturing, such as employment, prices paid, and inventories.
Frequency: Monthly
Current State of Index: The June Business Outlook Survey demonstrated continual contraction in the manufacturing sector, as current activity experienced a minor decline from May’s index. Future activity expected in this index turned positive in June, a hopeful sign that this manufacturing slowdown does not prolong for years. Employment figures in this index remained steady, while businesses reported unchanged prices for their products. This price trend bodes well for June’s inflation data, however activity in the Philadelphia Federal Reserve’s region still remains below historical norms.
Anxious Index
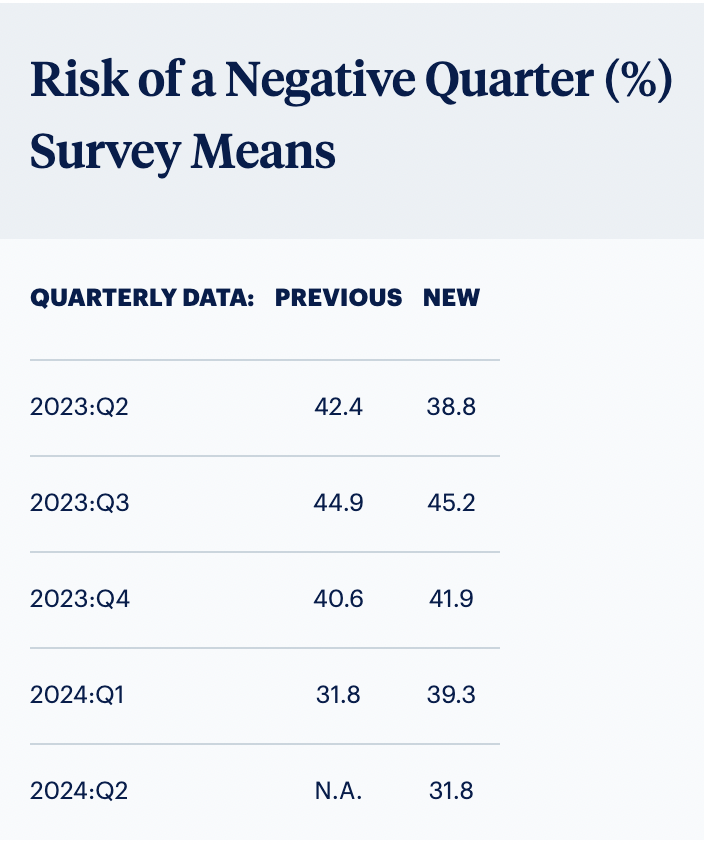
Significance: The anxious index is a survey of professional forecasters’ probabilities of real GDP declining in the next quarter. The data point has exceeded 40% in all eight of the recessionary periods since 1968.
Frequency: Quarterly
Current State of Index: The results of Q2 2023’s anxious index indicate a 38.8% probability of real GDP decline in the second quarter of 2023, according to professional forecasters. Although down from last quarter’s predictions, this high probability of a negative quarter does not bode well for the overall economy, especially when looking ahead to predictions for Q3 & Q4, which both sit above 40% and have increased in the most recent quarterly forecast.
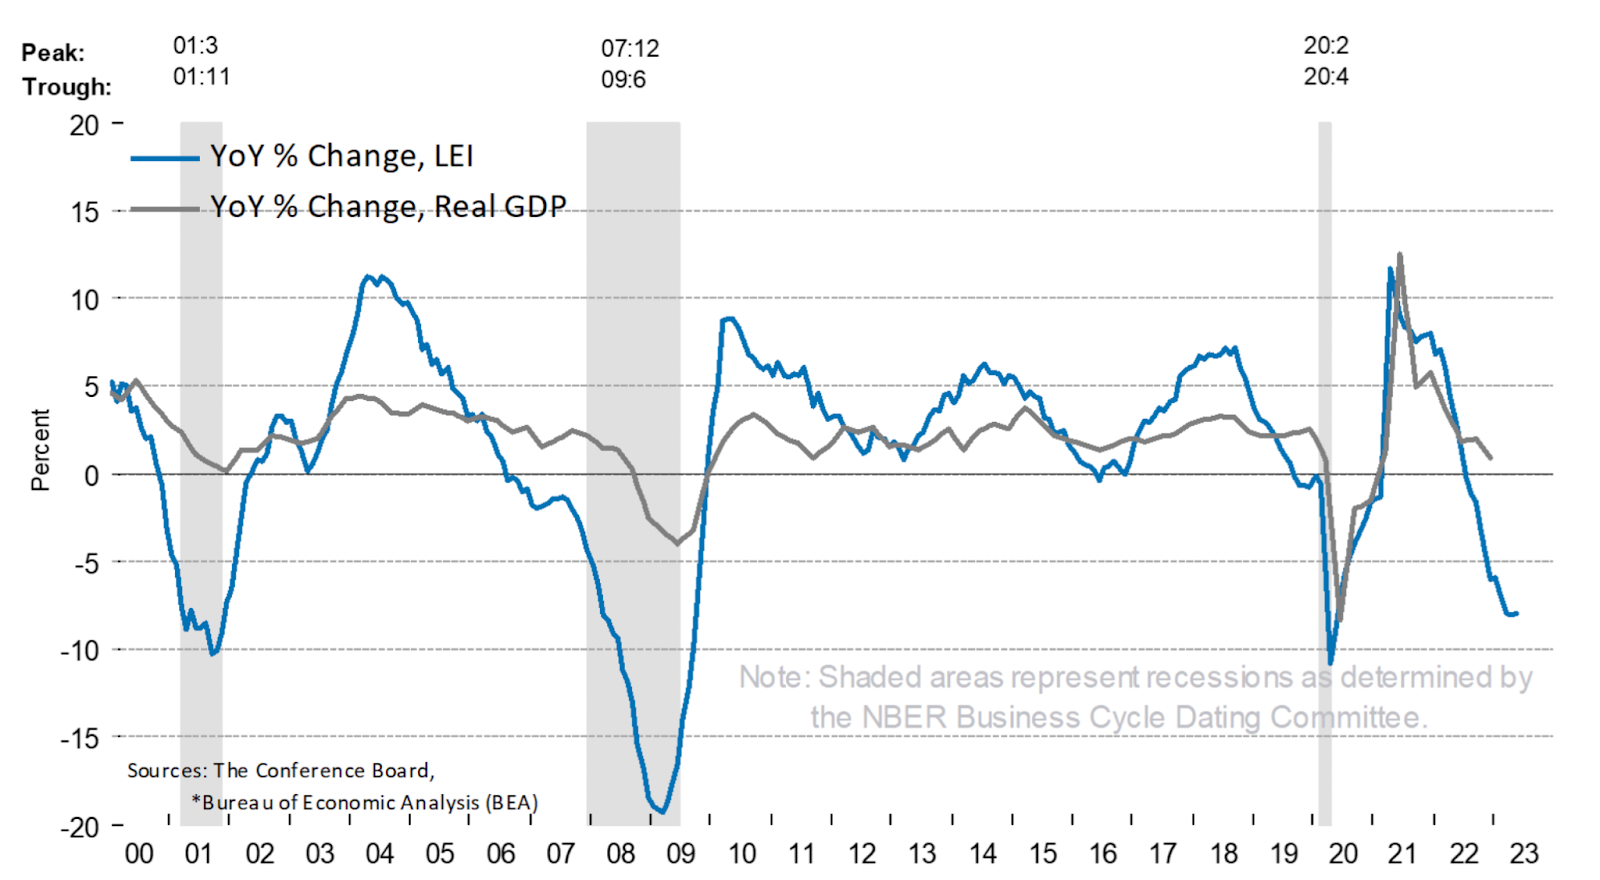
The Conference Board U.S Leading Economic Indicators Index
Significance: This tracks ten leading economic indicators such as manufacturing data, the S&P 500, and the 10 year UST to Federal Funds rate spread. It aims to lead turning points in the business cycle by about 7 months and has fairly accurately done this over the last 20+ years.
Frequency: Monthly
Current State of Index: May’s LEI index declined a further -0.7% from April’s data, as leading indicators point to a bleak economy ahead. Bringing this index lower, was a weaker ISM New Orders Index, slipping consumer expectations, a continually wide interest rate spread in US Treasury markets, as well as a depleted leading credit index. On the other hand, stock market stability and tightness in the private housing industry held up the LEI Index from falling more. Overall, this historically accurate Leading Indicators Index demonstrates a weak economy ahead.
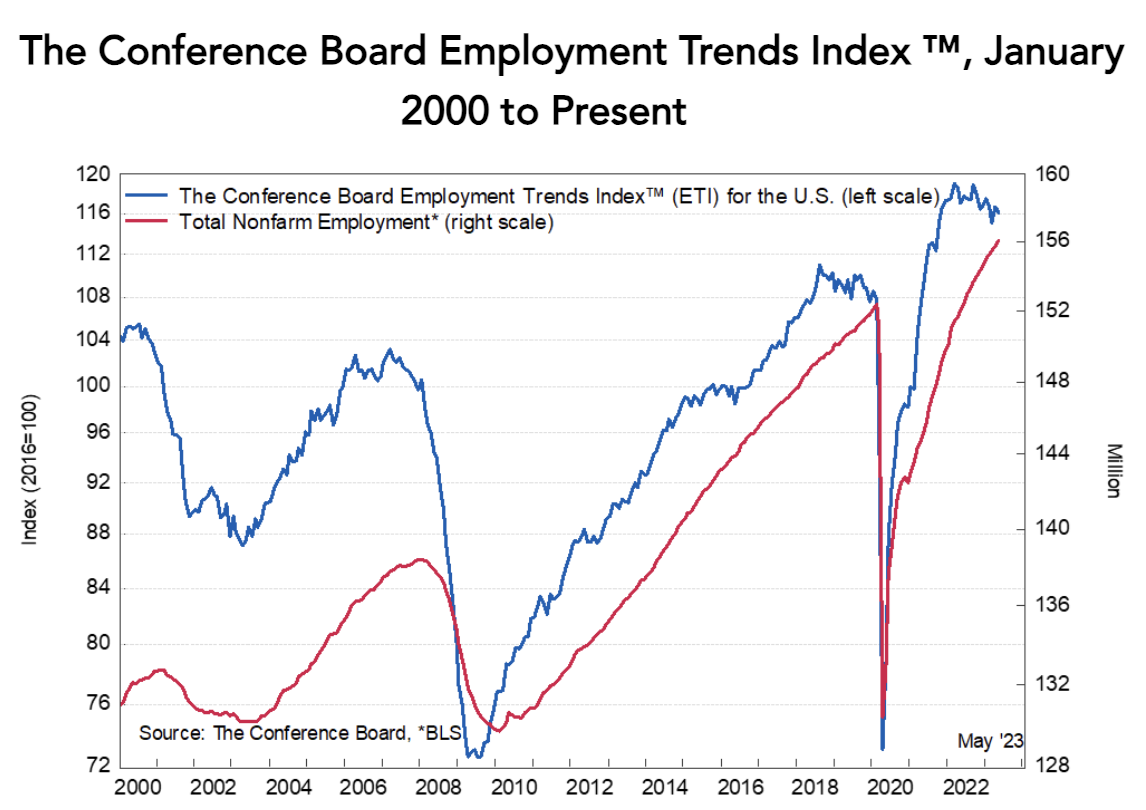
The Conference Board Employment Trends Index (ETI)
Significance: The employment trends index tracks eight employment indicators such as employment surveys, initial claims data, and job openings to more widely gauge the employment markets.
Frequency: Monthly
Current State of Index: The Conference Board Employment Trends Index declined slightly in May, indicating a slower job growth trend since its peak in March 2022. On the other hand, wage growth slowed but remains much above pre-pandemic levels. Overall, the labor market, according to the ETI, remains tight, with growth seen in service sectors and total employment, while weaknesses emerge in the information and technology sectors, along with some labor indicators like rising initial claims. As of June, this indicator is still neutral but has the potential to quickly turn bearish if a few negative employment data points roll in.
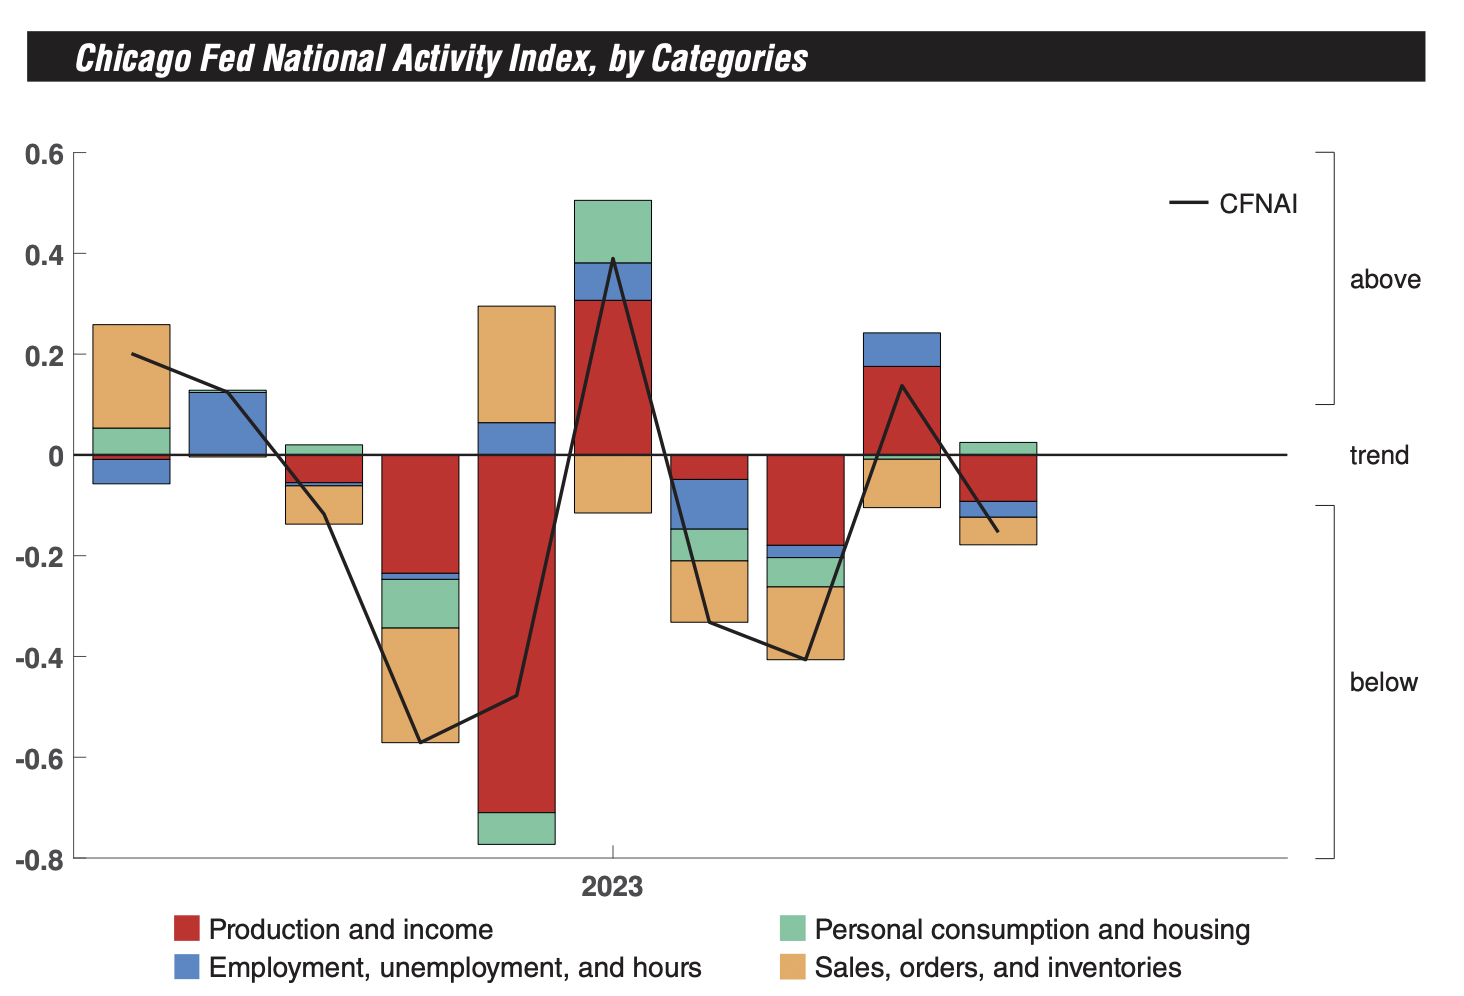
Chicago Fed National Activity Index (CFNAI)
Significance: The CFNAI aims to track overall economic activity and inflationary pressure through metrics of production and income, employment, personal consumption and housing, and inventory sales and orders. A reading of 0 is average, a reading above 0 demonstrates strong economic activity, and a reading below 0 demonstrates weaker economic activity.
Frequency: Monthly
Current State of Index: Economic growth declined in May according to the CFNAI, with production & income, along with sales & orders leading the decline. Even the employment aspect of this index slipped in May, which may be a pivotal point away from the tightness we have seen in labor markets over the last year. Currently, the index has not moved in a sustained downward manner quite yet, but within a few more bearish months, this indicator could be a recessionary data point.
Our team of skilled analysts will diligently monitor economic data as it becomes available in order to effectively manage each portfolio across different macroeconomic environments.
Thank you for your trust.
The information contained herein is general in nature. It does not take into account your particular investment objectives, financial situation, or needs. It is provided for illustrative or informational purposes only, and should not be construed as advice. Our advisors can meet with you to discuss your retirement plan.
Ready to Take The Next Step?
For more information about any of our products and services, schedule a meeting today or register to attend a seminar.