Market Update – August 23, 2023
Author: Joe Maas, CIO, SPG Advisors, LLC
Published August 23, 2023
Tactical Market Cycle Assessment
Welcome toour comprehensive monthly analysis of the market’s performance and short-term outlook. At Synergy, we pride ourselves on our data-driven approach, utilizing a sophisticated analysis that encompasses 40 technical, fundamental, and economic factors to provide a well-rounded assessment of the market’s current state. Our dynamic methodology empowers us to gauge the market outlook as either bullish or bearish, aiding in our process to make strategic portfolio decisions and tactical allocation adjustments.
Every month, our team diligently analyzes these 40 technical, fundamental, and economic factors, meticulously scoring each one as either bullish or bearish. We then consolidate the scores to form a hypothesis on the current mood of the markets. This thorough process allows us to gain valuable insights into the prevailing sentiment and helps us make well-informed decisions to navigate the dynamic financial landscape.
For this month, we have observed 34 bullish factors and 6 bearish factors, indicating a dominant stance by the Bulls with an 85% score, while the Bears hold a 15% score. We have seamlessly integrated this tactical score into our portfolio construction process. By factoring in these market insights, we believe that our portfolios are tactically aligned to take advantage of the prevailing market sentiment and optimize returns.
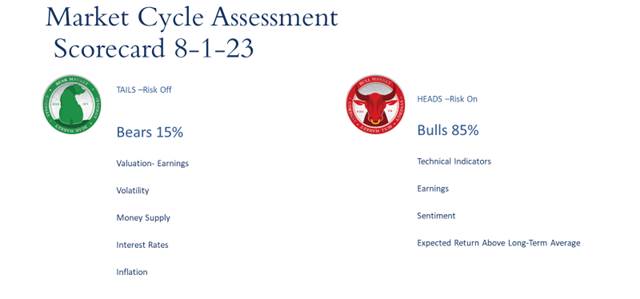
Among the 40 factors analyzed by our team, here are a few notable bulls and bears:
Bulls
- Technical indicators: Despite a recent pullback in August, equities remain above longer-term moving averages.
- Earnings: Q2 earnings have largely beaten analysts’ estimates, more so than long term averages of earnings beats.
- Sentiment: A variety of sentiment data points in the market point to a still optimistic consumer and investor, supporting the bull case.
- Expected Returns: Analysts’ expected returns for equities remain above long-term averages.
Bears
- Valuation: Forward-looking valuation methods on the S&P 500 appear bearish, as forward P/E ratios are higher than trailing twelve-month P/E ratios.
- Money Supply: The Fed has steadily been decreasing the money supply since 2022, which is a bearish factor on the economy.
- Interest Rates: With over 500 bps in rate hikes since early 2022, the Fed is keeping monetary policy tight, a bearish factor on our review.
- Inflation: Although it has come down drastically since the peak of Summer 2022, inflation remains elevated above the Fed’s 2% target.
Monthly Market Review
Incorporated in our Tactical Market Cycle Assessment, Synergy analysts and portfolio managers also consider broader macroeconomic data and trends in our assessment of market conditions. Among these data and trends, we often look through the lenses of inflation, interest rates, the Federal Reserve, corporate earnings, and geopolitical events.
Inflation
The most recent inflationary data points appear bullish as CPI, PPI, and PCE measures of inflation have demonstrated a strong trend down since 2022. Although most inflation measures put the year-over-year change in the price of consumer goods and services between 3-4%, this remains above the Federal Reserve’s 2% target. At this point, the most recent inflationary data stems from the July CPI, July PPI, and June PCE reports.
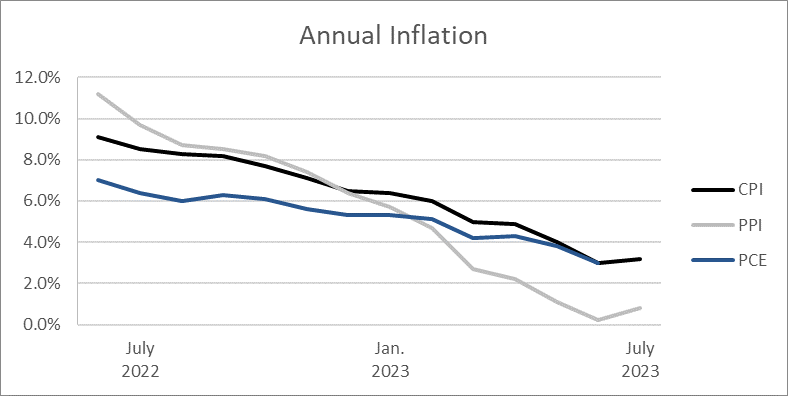
CPI
July’s Consumer Price Index revealed that Headline CPI stood at +3.2%, and Core CPI registered at +4.7% compared to the previous year. Both Headline and Core CPI increased by +0.2% on a monthly basis, which surprised economists to the downside. The driving force behind the July CPI report was primarily shelter costs, which saw an annual increase of +7.7% compared to July 2022, despite the presence of much higher interest rates. Limited housing supply paired with ample demand has kept shelter costs elevated and on the rise.
PPI
With a June Headline Producer Price Index near zero, July’s PPI did increase slightly more on an annual and monthly basis, but at a very moderate level compared to the double-digit producer inflation of 2022. Headline PPI was +0.8% from a year ago, while Core PPI showed a 2.7% increase in prices to producers from a year ago (which excludes food, energy, and trade).
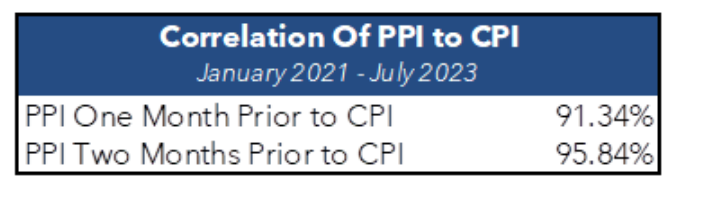
Why is PPI such a big deal? It is a leading indicator of CPI to come because producers tend to pass on higher costs to consumers, which later shows up in CPI and PCE reports. This has been extremely accurate in recent times, as from January of 2021 to July of 2023, the correlation of Headline PPI one month prior to a Headline CPI reading was 91.34% (ex: correlation between June PPI and July CPI). When looking at PPI two months ahead of CPI, the correlation proves even stronger, at 95.84%. You don’t need to be a statistician to know that correlations above the 90% range show a strong relationship. For these reasons, we are hopeful that consumer inflation will continue to move lower, as producer cost inflation continues to moderate lower.
PCE
June’s PCE showed inflation at an annual headline rate of 3% and Core PCE at 4.1%, both moderate rates that have come a long way since the highs of Summer 2022. Most important about the PCE, or Personal Consumption Expenditure, inflation metric, is that it is the Federal Reserve’s preferred metric. Looking ahead, July’s PCE will be the last PCE inflationary reading before the September 20th Federal Open Market Committee, with
Overall, inflation seems to be continuing its way down from the 40-year highs we saw in 2022. With encouraging data and a tight monetary policy from the Fed, we are hopeful that inflation will hit the Fed’s 2% target soon. We will continue to monitor inflationary outcomes as they roll out and manage portfolios appropriately based on each portfolio’s mandate and our tactical assessment of markets.
Interest Rates
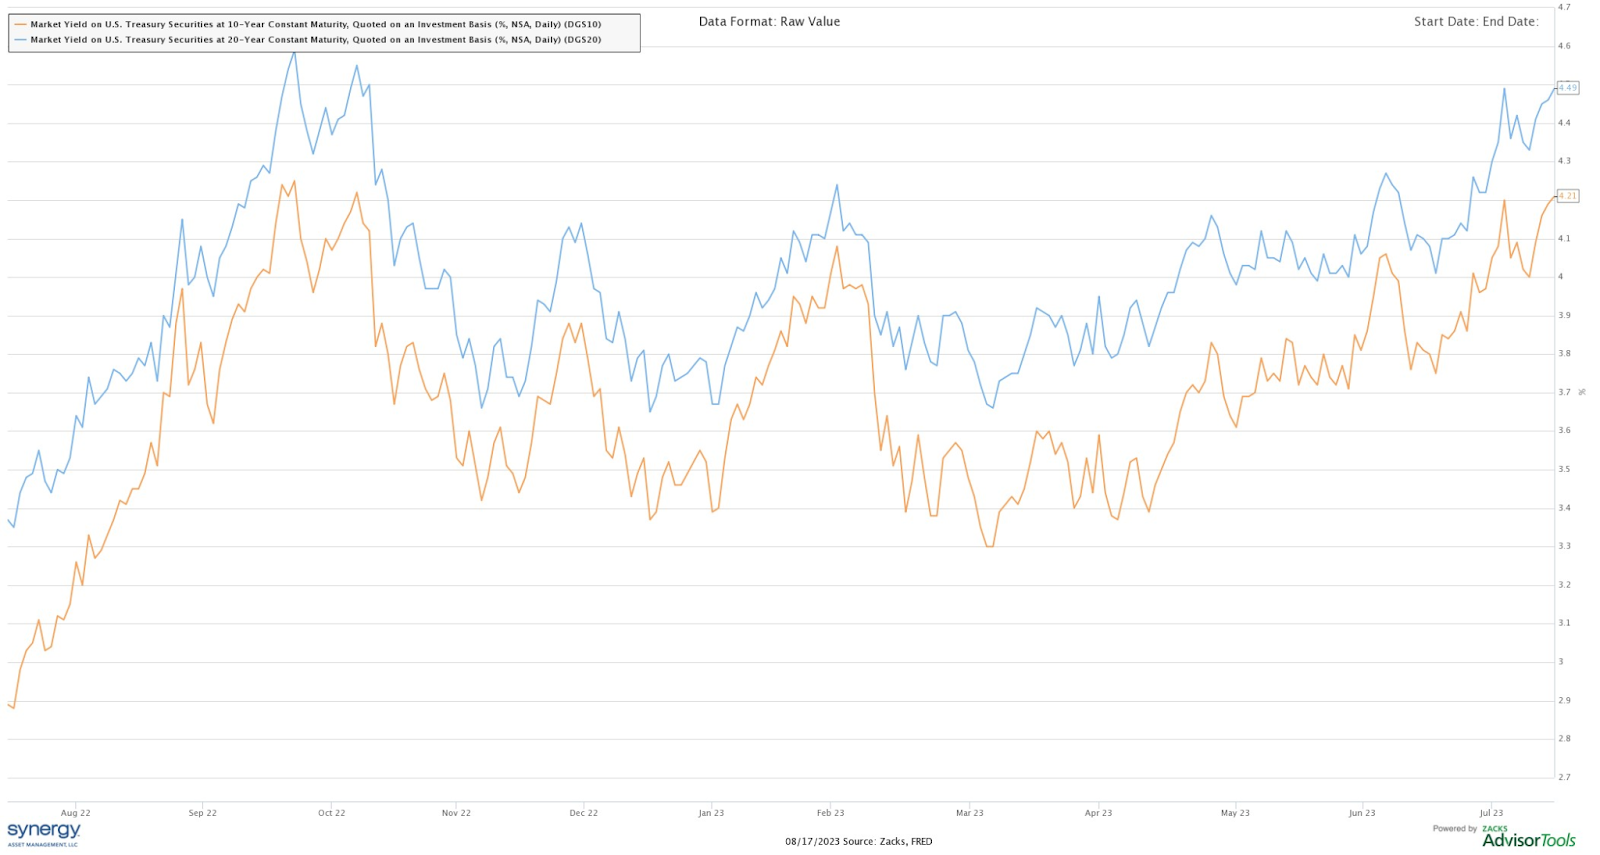
Long Term Treasury Yields Pick Up
For a multitude of reasons, US Treasury yields have trended up steadily since March, particularly on the farther end of the yield curve. As of August 15th, 10-year yields sit at 4.21%, while 20-year yields sit at 4.49%, both setting highs since yields peaked in late October 2022. Prior to this current cycle, the last time long term yields held above 4% like this was the financial crisis era over a decade ago, so rates this high for so long will definitely hold a variety of impacts on debt markets.
The Federal Reserve
Looking Ahead to the September FOMC Meeting
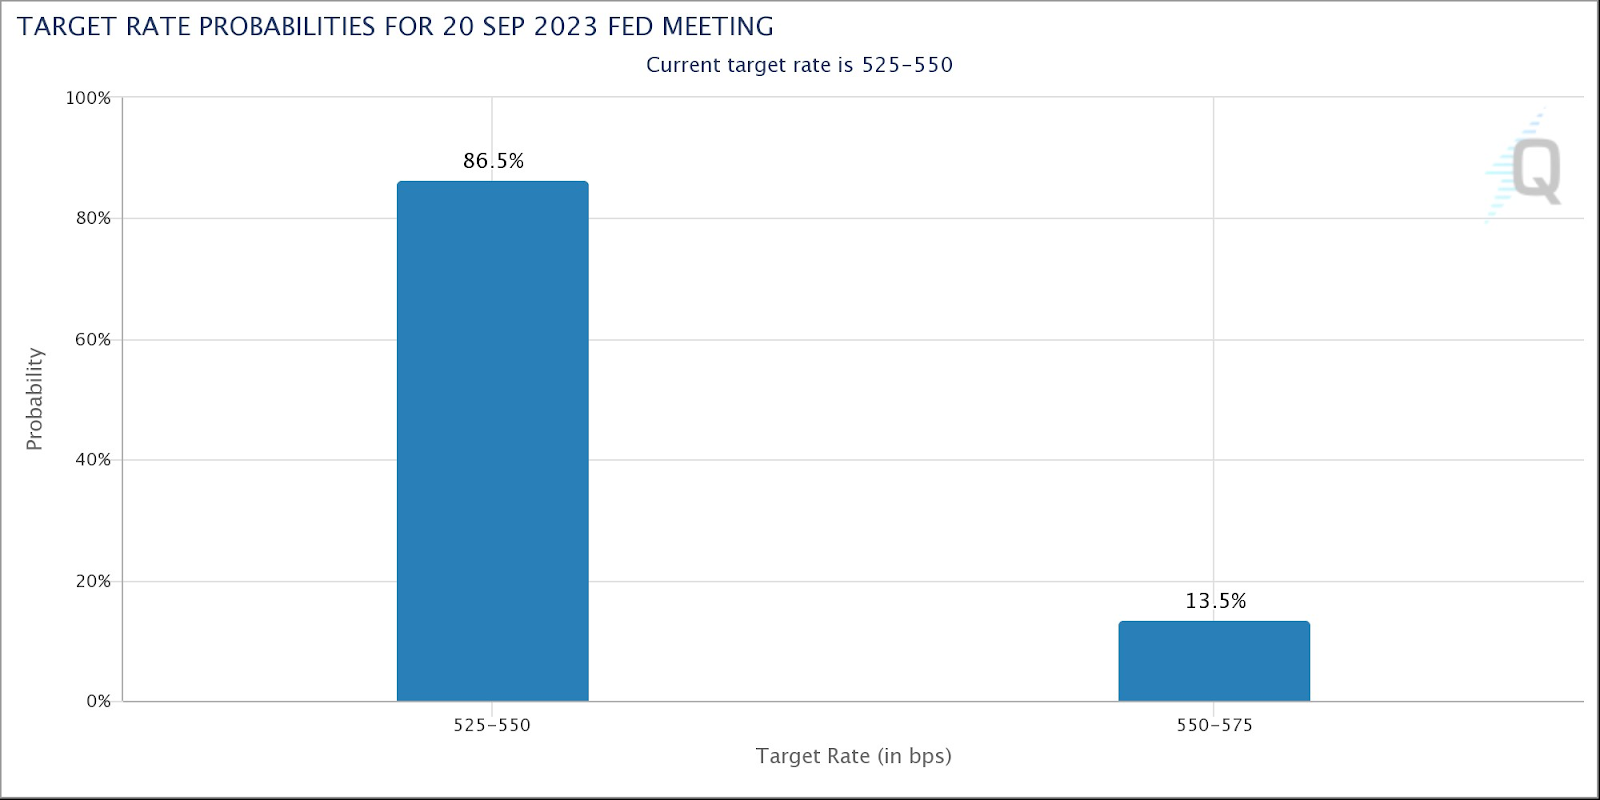
As we look forward to the chance of another rate hike in September, markets tend to be more accurate in pricing in probabilities, the closer we are to the decision date. As of August 17th, just over a month away from the September 20th announcement, markets expect only a 13.5% chance of a 0.25% hike at the meeting, however bullish data, such as a slimmer August CPI print or bearish data, such as more banking industry difficulties, could quickly swing the chances of a 25-bps hike.
At the November 1st meeting, markets are pricing a higher probability of a 25-bps hike, currently at 34.6% as of August 17th. We look forward to seeing how the Fed continues to act in the coming meetings and how markets choose to digest the decisions in monetary policy.
Source: CME Group
Corporate Earnings
Q2 Earnings
As a majority of S&P 500 companies have reported second quarter earnings at this point, the number of S&P 500 companies who have beat earnings estimates (~80%) is above long-term averages, but year over year performance varied largely by industry. Following robust earnings growth in the energy sector, out of pandemic oil price lows and the Russia-Ukraine crisis’ impact on global supply, energy companies could not keep up their earnings growth momentum in Q2. Materials and healthcare also saw year-over-year declines in earnings, which,
in addition to the energy industry, pulled the S&P 500’s annual EPS growth negative.
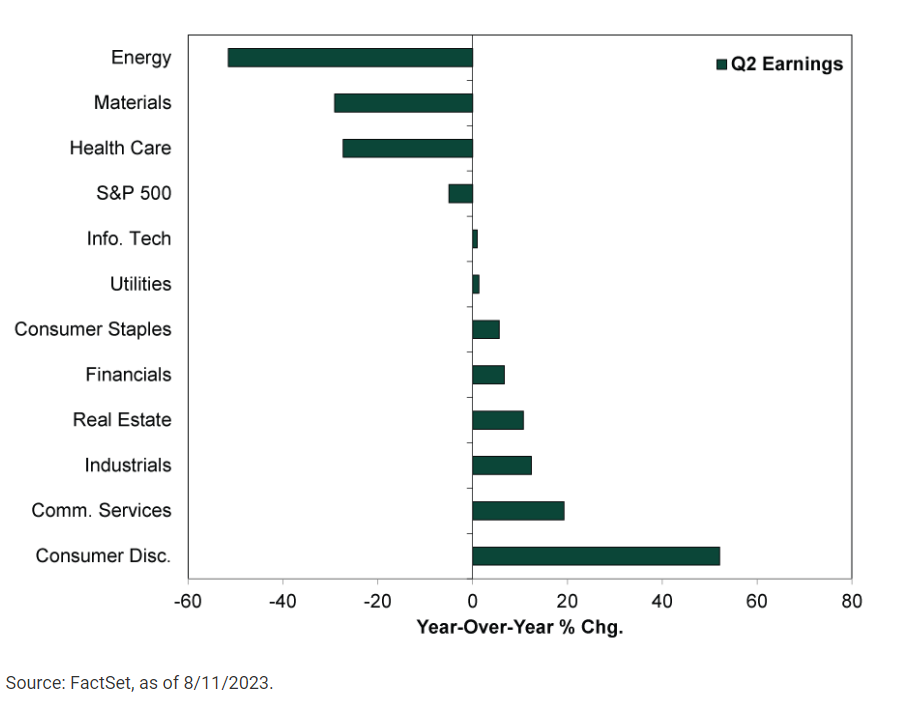
Typically, a decline in the S&P 500 earnings of this magnitude (~ -5% YoY) would concern markets more than the slight pullback for equities we’ve seen so far in August, however with so many earnings beats on estimates, on top of the overly negative sentiment we’ve had going into 2023, the US economy seems to be stronger than most estimated it would be after over 500 bps of rate hikes. We look forward to hearing from corporations on their outlooks and earnings for the rest of this year as it will bring valuable insight into our macroeconomic and tactical perspectives.
Geopolitical Events
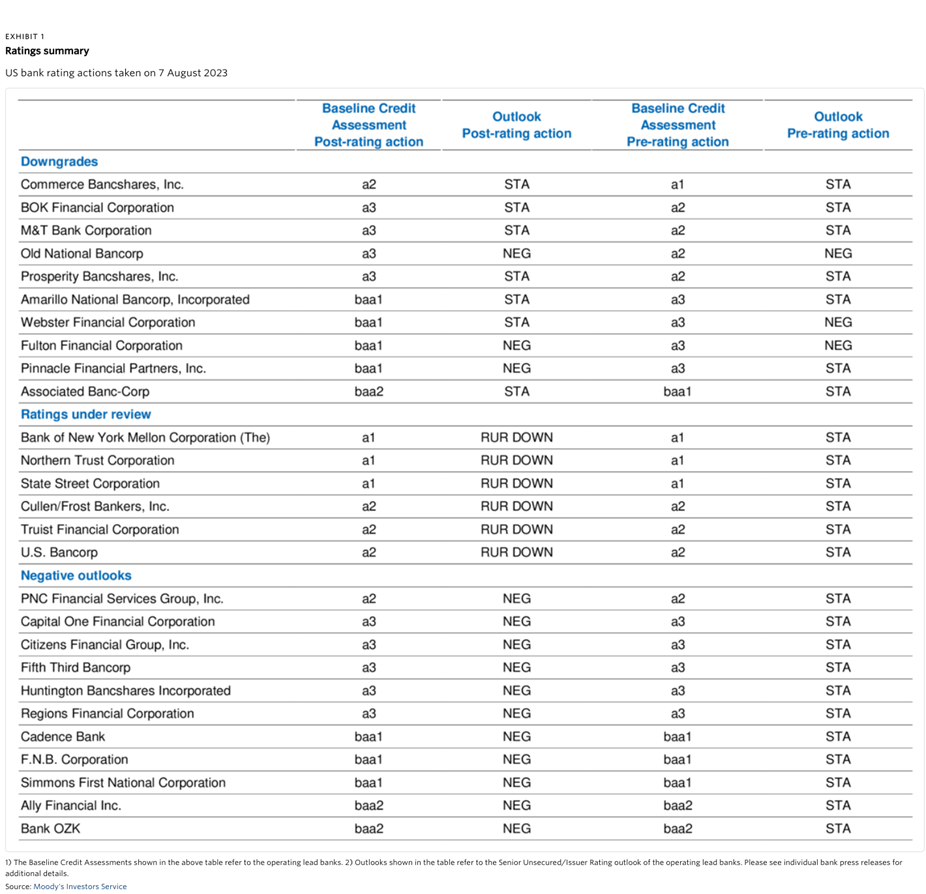
Credit Downgrades
One of the least expected events of August were the downgrades of the United States by Fitch, downgrades of 10 small and regional banks by Moody’s, and warnings that other bank downgrades from both Fitch and Moody’s may be on the horizon. Below, note the banks that were recently downgraded, banks that are currently under review from Moody’s, and those who now have negative outlooks. On top of these actions, Fitch has recently warned it may need to reevaluate its ratings of 70 banks it covers, including the behemoth of JPMorgan Chase & Co, if its outlook on the US banking sector becomes any more bearish.
Just as an individual with a lower credit score usually faces elevated interest rates when dealing with their debt, corporations like banks encounter a similar scenario when issuing debt. Their interest rates are influenced in part by credit scores assigned by rating agencies such as Fitch, Moody’s, or S&P. This is of particular importance to the banking sector, given its fundamental model of maintaining a borrowing and lending equilibrium, thereby generating profit from the margin. The significance of the banking system lies in its role of upholding financial liquidity, a crucial factor that sustains the day-to-day operations of businesses and households.
Currently, we are carefully observing the potential effects that these actions may exert on both markets and our portfolios. This vigilant monitoring will persist as the well-being of the banking system remains a critical component of the functionality of both the US and global economies.
We deeply appreciate the chance to analyze essential economic and market data as part of our tactical market assessment. This complements the numerous other perspectives we employ to diligently oversee the state of the US and global economies.
The information contained herein is general in nature. It does not take into account your particular investment objectives, financial situation, or needs. It is provided for illustrative or informational purposes only, and should not be construed as advice. Our advisors can meet with you to discuss your retirement plan.
Ready to Take The Next Step?
For more information about any of our products and services, schedule a meeting today or register to attend a seminar.