2023 Year End Market Update – January 10th, 2024
Author: Joe Maas, CIO SPG Advisors LLC
January 10th, 2024
Year End 2023
What’s inside?
1. Economic Cycle Update
In a structured fashion, conducted on a quarterly basis, we undertake an in-depth examination of the economies performance. This rigorous analysis extends beyond the immediate horizon and focuses on the strategic outlook for the longer term. This systematic approach allows us to formulate informed and forward-looking strategies that align with our clients’ financial goals and objectives.
2. Market Cycle Update
On a regular basis, typically monthly, and as necessary, we conduct a comprehensive evaluation of market performance, along with a strategic analysis geared towards the short-term outlook. This ongoing assessment forms a crucial part of our investment strategy and decision-making process, ensuring that we remain agile and well-informed in the dynamic financial landscape.
3. Market Update
At the conclusion of each quarter, we provide a comprehensive recap of various critical elements within the financial landscape. This recap encompasses an in-depth analysis of financial markets, interest rates, Federal Reserve actions and policy shifts, corporate earnings reports, and pertinent geopolitical events that transpired during the quarter. Our aim is to furnish our clients with a holistic understanding of the broader economic context, enabling them to make well-informed financial decisions in a complex and ever-evolving environment.

Welcome to Synergy Asset Management’s Economic Cycle Assessment, our quarterly analysis of the market’s performance and our strategic outlook, based on the primary drivers of the market – interest rates, inflation, the Federal Reserve, corporate earnings, and geopolitical events.
Every quarter, our team of senior analysts analyze a list of qualitative and quantitative factors of the economy, as we assess what part of the cycle we find ourselves in. This process allows us to adopt longer-term views on the economy and markets, which ultimately inform our portfolio positioning.
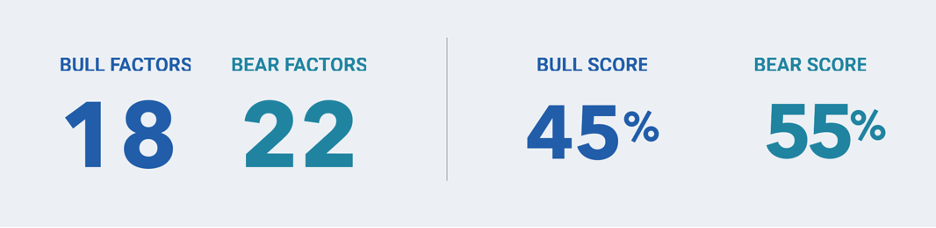
Following the end of Q4 2023, we have observed 18 bullish factors and 22 bearish factors in our longer-term economic view, indicating a dominant stance by the Bears with a 55% score, while the Bulls hold a 45% score. We have integrated this longer-term, strategic score into our portfolio construction process. By factoring in these market insights, we believe that our portfolios are strategically aligned to take advantage of the prevailing market sentiment and optimize returns.
Economic indicators have progressed to appear slightly more bullish than Q3. Below is a brief overview of some of our leading indicators for both the Bulls and the Bears:

Interest Rates
Given the likelihood that interest rates have reached their peak, this presents a potential positive catalyst for our mid-term outlook. Longer-term Treasury yields and various benchmarks are now in a less restrictive territory. Additionally, we anticipate the Fed will implement rate cuts by March or May, providing more room for yields to decline – a bullish factor in our economic cycle assessment.
Federal Reserve Positioning
While the Fed may persist in limiting the money supply, we anticipate their stance on interest rates will shift towards a more accommodative position. This supports a positive perspective on our medium-term economic outlook, provided they successfully strike a balance between curbing inflation and maintaining labor market stability.
Historically Strong GDP Growth
The most recent real GDP data exhibited robust growth, surging at an annual rate of 4.9% in the third quarter of 2023. This growth surpassed expectations, indicating that the economy is performing better than some had thought. Additionally, there is potential for the fourth quarter GDP to also reveal stronger than expected growth.

Corporate Earnings
While corporate earnings exceeded expectations across the S&P 500 as a whole during Q3, the outlook for annual earnings growth for fiscal year 2023 and into the new year is anticipated to be weaker than historical norms, especially as slowing inflation cuts into companies’ pricing power.
Cautionary Sentiment
The prevailing sentiment has shifted from the bullish run observed in most of November and December to a more cautious tone. Investors are adopting a disciplined and somewhat pessimistic approach toward entering the market at the moment.
Economic Indicators
Key economic indicators, including the ISM Manufacturing Index and the Leading Economic Index, suggest an impending recession or slowdown in the near future.

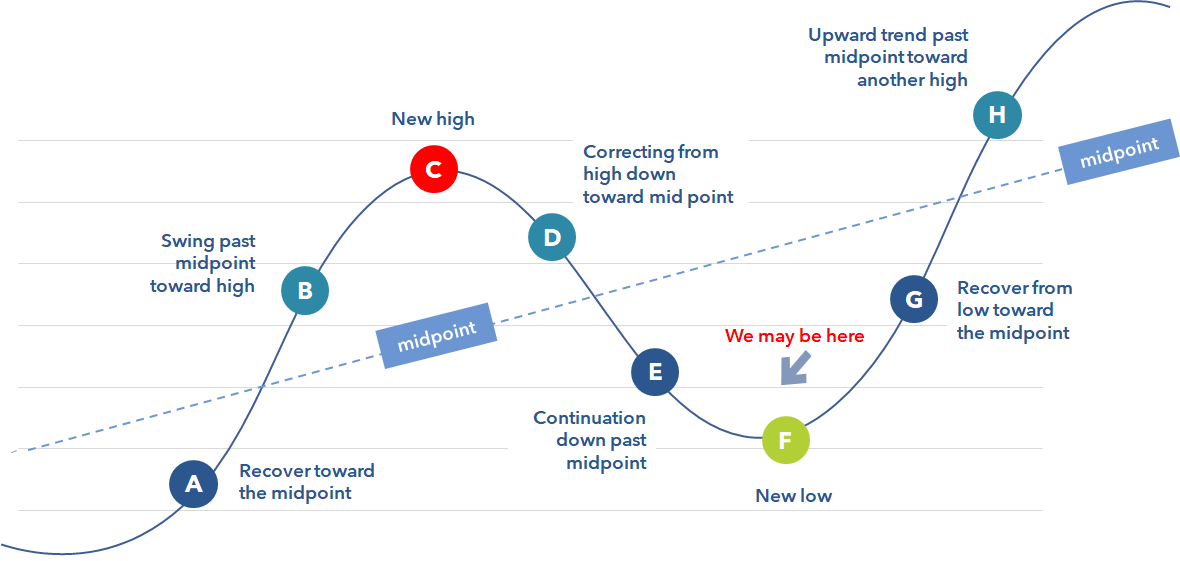
Synergy Asset Management’s Tactical Market Cycle Assessment, is our comprehensive analysis of the market’s performance and short-term outlook. At Synergy, we pride ourselves on our data-driven approach, utilizing a sophisticated analysis that encompasses 42 technical, fundamental, and economic factors to provide a well-rounded assessment of the market’s current state. Our dynamic methodology empowers us to gauge the market outlook as either bullish or bearish, aiding in our process to make strategic portfolio decisions and tactical allocation adjustments. Here is how our views have changed over the quarter:
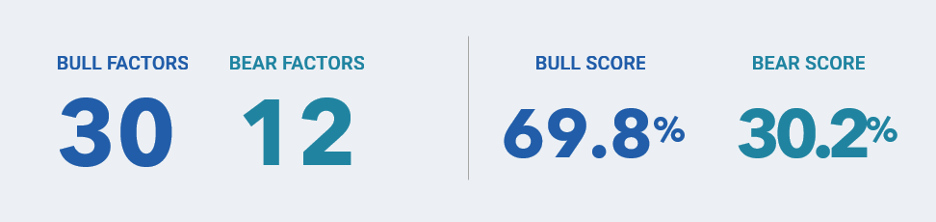
As of January 3rd, we have observed 30 bullish factors and 12 bearish factors, indicating a dominant stance by the Bulls with a 69.8% score, while the Bears hold a 30.2% score. By factoring in these market insights, we believe that our portfolios are tactically aligned to take advantage of the prevailing market sentiment and optimize returns.
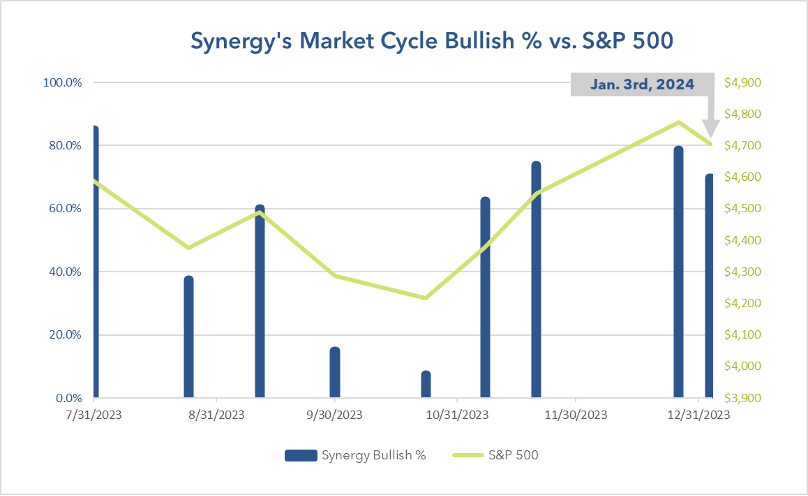
Market Cycle scores observed throughout 2023:

% of Members Above Moving Averages
We have continued to witness robust engagement in this stock market rally extending beyond mega-cap stocks and into mid- & small-cap stocks as well. A rising number of stocks within both the S&P 500 as well as across broader indexes have surpassed their 50, 100, 150, and 200-day moving averages. This factor has not materially changed since our December report.
Near All Time Highs
Despite some factors signaling a more bearish sentiment, the S&P 500 and other major stock indexes are still in proximity to their 52-week and all-time highs. The bullish trend may continue to attract investor attention, potentially driving additional market inflows as individuals increasingly deploy their cash into investment opportunities.
Bond Market Fundamentals
Similarly, to stocks, which are still trading at relatively high levels compared to recent months, the Barclays Aggregate Bond Index is a few percentage points away from its 52-week high. Anticipating the Fed to cut interest rates in the first half of 2024, there is potential for bonds to experience a continued rally or stability if rates are cut as expected.

Volatility
As highlighted in our December Monthly Market Cycle Update, the VIX is currently exhibiting mean-reverting behavior, experiencing a notable increase in recent days. This uptick in volatility suggests the potential emergence of a more cautious trend in the market.
AGG Pullback
While certain technical indicators suggest that the Barclays Aggregate Bond Index may have been overbought in the near term, its performance looking forward largely hinges on obtaining more clarity from the Fed regarding potential rate cuts in 2024.
Options Activity
Key indicators in the US options markets, such as the put-to-call ratio, indicate more near-term bearish sentiment, reflecting an uptick in puts compared to calls.
Breadth Indicators
Similar to our December monthly reporting, technical indicators, gauging factors such as the breadth of the rally, are signaling a sense of caution across major indices. These indicators suggest that the current rally may be displaying indications of overbuying.

Financial Markets
Our overarching objective, which we term our “Reasonable Goal” at Synergy Asset Management, is to attain returns that are both reasonable and commensurate with the level of risk taken, all within a reasonable time frame. We accomplish this by employing diversified portfolios and conducting a thorough analysis that encompasses economic, fundamental, and technical factors. In this multifaceted approach, we consider variables such as inflation, interest rates, Federal Reserve policy, corporate earnings, and geopolitical events.
With utmost diligence and precision, we tailor our portfolio management to align with the specific mandates of each investment vehicle. Our primary aim is to achieve optimal risk-adjusted returns, striking a delicate balance between risk and reward. In doing so, our team of analysts is dedicated to mitigating the impact of bearish trends, thereby minimizing downside risks, while capitalizing on bullish trends to maximize upside potential. This commitment to a disciplined and balanced approach underscores our dedication to delivering consistent, reliable results for our valued clients.
Quarter & Year End Results
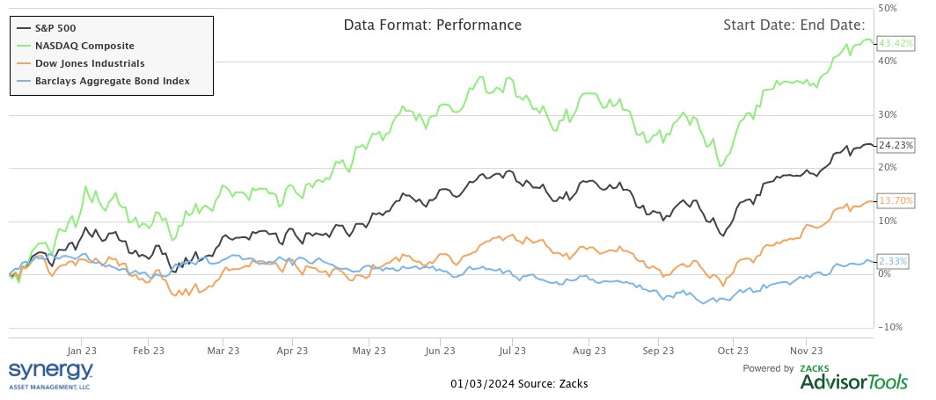
In 2023, both stocks and bonds witnessed notable gains across major indices. The Nasdaq Composite surged by +43.42%, the S&P 500 gained +24.23%, and the Dow Jones Industrial Average rose +13.7%. Furthermore, the Barclays Aggregate Bond Index experienced a positive uptick of +2.33%, marking the first positive year for the bond market since 2020.
2023’s positive performance offset much of the negative returns we saw in 2022, pulling the Dow Jones to an all-time in December, with the Nasdaq composite and S&P 500 ending the year a few percentage points off their all-time highs.
On the global stage, the FTSE All-World ex. US Index posted a gain of +11.97%, although it remains distant from its 2021 all-time high. These results reflect a strong resurgence in the U.S. markets and positive trends in international equities, signaling a favorable environment for investors.
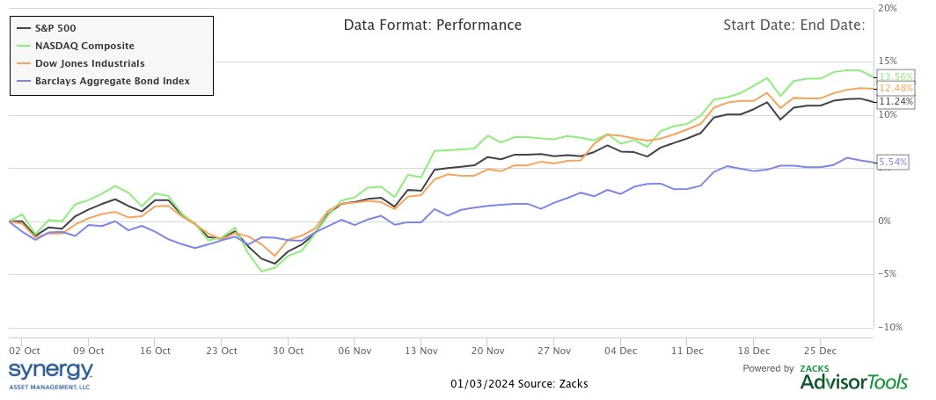
Looking at the fourth quarter alone, a substantial portion of this year’s gains can be attributed to this period. The bond market experienced a turnaround, surging by +5.54% in the last quarter of the year. Similarly, November marked a historic month for the bond market, with the Barclays AGG recording its best monthly performance since 1997, boasting a significant increase of +4.28%.
For stocks, the final quarter of 2023 provided more evenly distributed gains across major indexes. The Nasdaq Composite rose by +13.56%, the Dow Jones saw a notable increase of +12.48%, and the S&P 500 posted a solid gain of +11.24% in Q4.
The Fear of Missing Out (FOMO)
Human bias, often driven by the fear of missing out (FOMO), can play a significant role in investment decisions. Let’s consider a scenario over the course of two years. In the first year, risk-on equity strategies experience substantial declines, leaving investors feeling frustrated. In contrast, risk-off strategies like cash or diversified asset allocation models fare comparatively better, with smaller losses. However, the following year, risk-on strategies stage a remarkable recovery, while risk-off strategies yield only modest gains. This resurgence tempts investors to abandon their conservative approaches and jump back into riskier assets. It’s a classic case of FOMO in action, where the allure of potentially higher returns can overshadow the benefits of capital preservation.
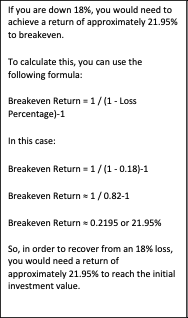
In 2023, the stock market exhibited a robust performance, a notable contrast to the challenging year experienced in 2022. The market’s susceptibility to substantial percentage fluctuations came into clear view, as a 18% loss required a 22% gain to regain its initial value. This recurring pattern is reflective of the current market landscape. Interestingly, over the past two years, investing in a 3-month US Treasury bill proved to be a more favorable choice compared to the S&P 500.
Furthermore, it’s worth noting that individuals often exhibit myopic perspectives. Those who held cash or pursued asset allocation strategies in 2023 might have felt the tug of FOMO or questioned the suitability of their portfolio. However, when taking a broader view that encompasses both 2022 and 2023, their perspective may undergo a significant shift. This underscores the importance of considering the larger investment horizon and maintaining a balanced, diversified approach to navigate the complexities of the financial markets effectively.
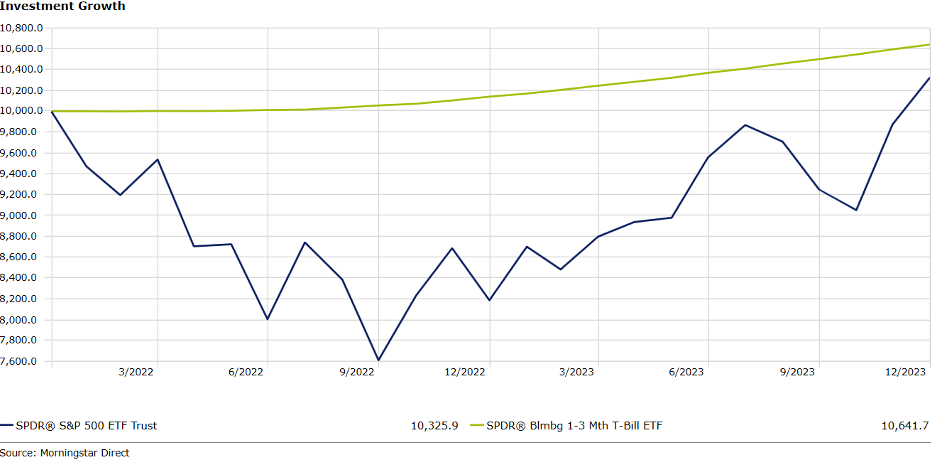
For instance, if you had invested $10,000 in the S&P 500 on January 1st, 2022, with dividends reinvested, your portfolio would have grown to $10,325 by the end of 2023, representing an average annual gain of less than 2%. Conversely, investing the same amount in a 3-month US Treasury bill at the beginning of 2022 would have resulted in an ending balance of $10,641, boasting an average annual return of nearly 3%. Despite these gains, both investments fell short of keeping pace with inflation, resulting in negative real returns over the two-year period, whether in cash or the S&P 500. This underscores the importance of adopting a nuanced and diversified investment strategy when navigating the complexities of the market, as well as recognizing the substantial impact of compounding returns, be they positive or negative.
The lesson to be gleaned from this narrative is not to pursue returns hastily or deviate from your investment strategy based on a single time frame. Avoid allowing the fear of missing out (FOMO) to dictate your investment decisions. Instead, trust in a sound financial plan that is seamlessly integrated with your investment policy statement to serve as your guiding compass in the world of investments.
What Worked in 2023
In 2023, growth and large-cap stocks proved to be especially successful, along with certain sectors that align with those same styles. The Russell 1000 Growth index surged by +41.51% throughout the year, with large cap stocks largely outperforming small caps. In terms of sectors, technology stood out with an impressive gain of +56.0%, followed closely by communication services, which saw a significant uptick of +52.8%. Additionally, the consumer discretionary sector showed robust strength in discretionary spending, recording a gain of +39.6% in 2023.
For individual stocks, diverse industries witnessed standout performers, but tilted towards AI & Technology trends. Nvidia (NVDA) dominated the S&P 500 with a stock surge of +254% in 2023 with hype around its AI potential and strong current financial performance. Meta Platforms (META) nearly tripled its stock value, driven by CEO Mark Zuckerberg’s “year of efficiency” coming into fruition. Royal Caribbean (RCL) and Uber Technologies (UBER) capitalized on pandemic reopening trends and increasing demand for travel services, achieving stock surges of over +165% and +140%, respectively. Building supplies company, Builders First Source (BLDR), unexpectedly thrived, with over a +155% rise in shares and its inclusion in the S&P 500, after a great year of accretive acquisitions and an increasing demand for residential buildings.
What Didn’t Work in 2023
Not all strategies and sectors fared well in 2023. Dividend stocks underperformed, with the S&P 500 Dividend ETF (SDY) experiencing a dip of -0.11%, excluding dividends. By sector, utilities faced a notable decline of -7.17%, while consumer staples and energy sectors both recorded decreases of -0.83% and -0.64%, respectively. These trends underscore the varying performances across different investment styles and sectors in various market conditions, highlighting the importance of vigilant market monitoring and ongoing analysis.
On the individual company level, FMC Corporation (FMC), a leading agricultural chemical manufacturer, saw a more than -49% stock decline due to inflationary pressures, impacts of high interest rates, and strategic shifts. Enphase Energy (ENPH) faced “green” energy sector headwinds, resulting in a -47% stock loss. Dollar General (DG) experienced a roughly 45% stock decrease due to shifting consumer spending patterns amid high inflation. Pharmaceutical companies, Moderna (MRNA) and Pfizer (PFE) struggled as the pandemic subsided, leading to a -44% decline in stock prices due to reduced demand for vaccines and boosters.
S&P 500 Sector Performance (ranked by YTD 2023)
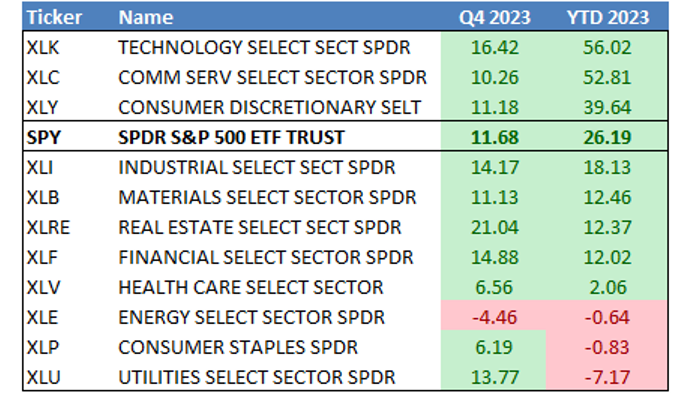
Source: Bloomberg and Synergy Asset Management, LLC
Inflation
2023’s Fight Against Inflation:
Luckily for the equity markets, CPI, PCE, and PPI inflationary metrics have all made significant progress in 2023. The Consumer Price Index began the year with an annual inflation rate of 6.4% in January, steadily halving to 3.1% by November, significantly influenced by lower energy prices and moderating inflation in most other categories. Similarly, Core CPI, started the year at 5.5% and concluded 2023 at a rate of 4.0%, per the latest November CPI report.
Within the November CPI report, data demonstrated a +6.5% increase in shelter costs compared to the previous year, though this inflationary trend appears to be moderating in the face of higher rates. Transportation services displayed a significant +10.1% increase in prices from a year ago. Conversely, energy costs decreased by -5.4%, primarily due to drops in gasoline and fuel oil prices, while used vehicles continued to deflate, experiencing a -3.8% decrease in prices from a year ago.
For Personal Consumption Expenditures inflation, the annual rate fell from 5.3% to 2.6% from January to November, accompanied by a drop in Core PCE inflation from 4.7% to 3.2% over the same period. The November PCE report also marked the first monthly decrease in prices, according to the headline PCE index – the first time since 2020.
In Producer Price Index inflation, producer prices declined more rapidly than consumer inflation, with PPI and Core PPI starting the year at 5.7% and 4.4%, respectively, and ending the year at 0.9% for PPI and 2.5% for Core PPI in November.
Overall, inflation moved down more swiftly than anticipated in 2023, a phenomenon underscored by even the Federal Reserve’s projection of PCE inflation at 3.3% by year end 2023, compared to the actual 2.6% annual inflation reported in November, which will likely stay the same or fall further in December.
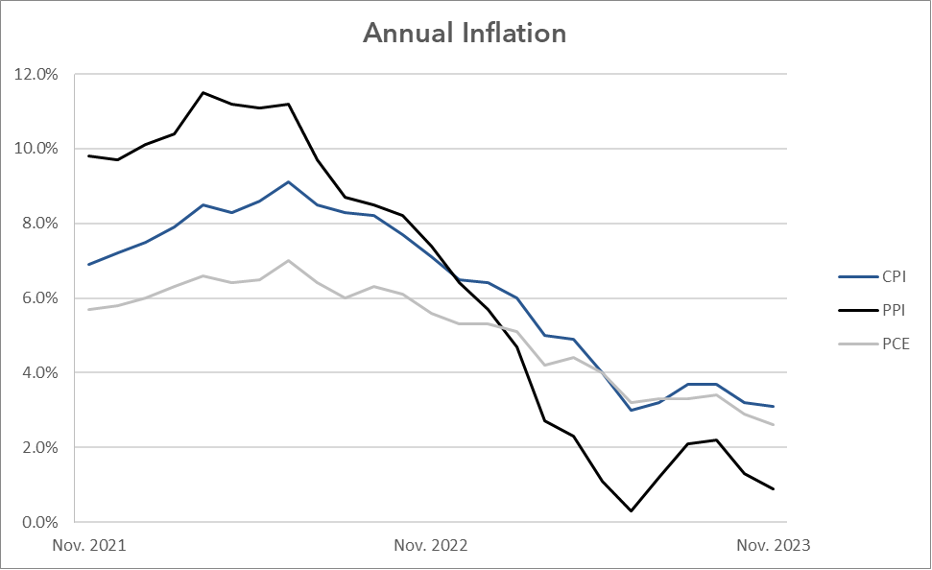
Source: BLS
Disinflation vs. Deflation
In the context of the 2023 inflation trends, the distinction between disinflation and deflation becomes crucial. The notable decline in overall inflation, especially in measures like CPI, PCE, and PPI, illustrates elements of disinflation – a deliberate slowdown in the rate of inflation, suggesting that while prices are still increasing, the pace has decelerated.
Disinflation and deflation are both economic terms related to a decrease in the general price level of goods and services, but they have distinct characteristics:
1. Disinflation: Disinflation refers to a slowdown in the rate of inflation. In other words, prices are still rising, but at a decreasing rate. During disinflation, the rate of price increases becomes more moderate, and the overall price level continues to rise, albeit at a slower pace. Disinflation is often considered a normal and expected part of a healthy economy, as it reflects a reduction in the pressure of rising prices without entering a deflationary spiral. Central banks may use monetary policy tools to manage and control disinflation to maintain price stability.
2. Deflation: Deflation, on the other hand, is a sustained and generalized decrease in the price level of goods and services. In a deflationary environment, prices are consistently falling, and this can lead to a variety of economic challenges. Deflation can be harmful to an economy because it encourages consumers to delay spending as they anticipate lower prices in the future. This reduction in consumer spending can lead to decreased demand for goods and services, lower production, and ultimately, job losses. Central banks typically aim to prevent deflation and maintain mild inflation to stimulate economic growth and stability.
In summary, disinflation represents a slowing down in the rate of price increases, while deflation indicates a persistent decrease in the overall price level. Both have distinct impacts on economic conditions and require different policy responses from central banks and policymakers.
Supply and demand dynamics play a pivotal role in influencing inflation. Inflation, in essence, is the rise in the general price level of goods and services over time. When demand for goods and services outpaces their supply, it creates upward pressure on prices, leading to inflationary tendencies. This occurs because consumers are willing to pay more for the limited available supply. Conversely, when supply surpasses demand, it tends to exert downward pressure on prices, resulting in deflationary pressures. Central banks and policymakers closely monitor supply and demand imbalances as they can have significant implications for the overall health of an economy. Finding the right balance between supply and demand is crucial in maintaining price stability and sustainable economic growth.
The nuanced understanding of these terms is vital for the Fed as they strive to find a balance between moderate inflation and maintaining maximum employment. The next time you encounter news about inflation trending “down,” keep in mind that it usually denotes disinflation – a scenario where the rate of inflation is decelerating, not necessarily implying that prices are actively decreasing.
Interest Rates
Last of the Rate Hikes:
2023 will likely go down as the end to the Federal Reserve’s cycle of rate hikes, barring an unforeseen resurgence of extreme inflation. The Fed Funds rate, beginning the year at 4.25-4.5%, concluded 2023 at 5.25-5.5%, following four 25-basis point hikes throughout the year, with the final one in July. Presently, markets are pricing in a 70.2% probability (as of January 5th) of a rate cut by the March FOMC meeting, a stance that may be more aggressive than what the Federal Reserve is contemplating.
However, the potential for a rate cut remains on the table, particularly if ongoing inflationary data continues to indicate disinflationary trends. The delicate balance between managing inflation and maintaining maximum employment was an intriguing update of this quarter and will likely remain a focus for the Federal Reserve as it navigates its key interest rate policy in the coming months.
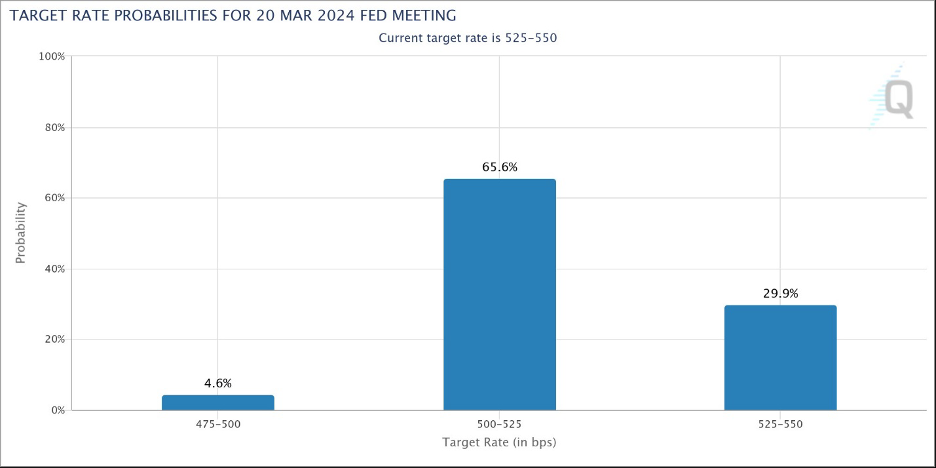
Source: CME Group
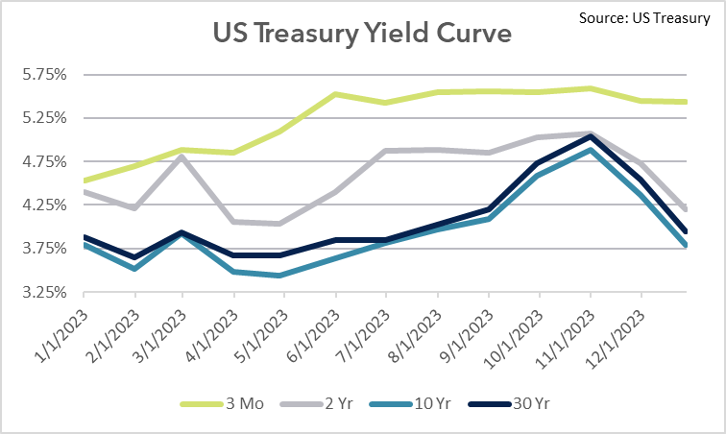
Yield Curve Dynamics
The yield curve, a compilation of yields on different maturities of US Treasury bonds, as well as general Treasury market moves have garnered heightened attention from investors, particularly in the last two months as longer-term treasuries witnessed a decline in yields.
The 3-month yield moved in sync with Fed rate hikes throughout the year. On the other hand, the 2-year yield, often correlated with near-term expected inflation and influenced by Fed rate decisions, initially experienced a steady ascent in the first half of the year but has recently fallen below 5% as inflation expectations ease. Conversely, the 10 and 30-year yields exhibited an upward trajectory until late October, when unexpectedly positive inflation data prompted a downward shift in yields.
Persistently offering a lower yield compared to the 3-month, the 10-year yield has prolonged the yield curve inversion, which has become more pronounced over the last two months. While this inversion typically signals an upcoming economic slowdown, it’s crucial to approach this data with caution, recognizing the possibility that it may be an anomaly amid the broader complexity of various economic data points.
The transition from an inverted yield curve to a positive yield curve is a significant event in the financial markets and is closely monitored by economists and investors due to its potential implications for the economy. Here’s an explanation of how this transition can occur and its impact:
1. Inverted Yield Curve to Positive Yield Curve:
- An inverted yield curve occurs when short-term interest rates are higher than long-term interest rates. This unusual scenario is often seen as a warning sign of an impending economic slowdown or recession. It suggests that investors are seeking the safety of longer-term bonds, driving their prices up and yields down.
- When the yield curve transitions from inverted to positive, it means that short-term interest rates have decreased relative to long-term rates. This shift typically occurs as central banks, like the Federal Reserve, implement monetary policy measures to stimulate the economy. Lowering short-term interest rates is one such measure.
2. Recession Risk:
- A positive yield curve is generally considered a more normal and healthy state for the economy. It implies that investors have more confidence in the near-term economic outlook and are demanding higher yields for longer-term investments.
- However, recessions can still occur even after the yield curve turns positive. This is because the yield curve is just one of many economic indicators, and it may take some time for its impact to materialize.
- Recessions can be triggered by various factors, including external shocks, changes in consumer and business sentiment, or imbalances in the economy. Therefore, while a positive yield curve is a positive signal, it doesn’t guarantee economic stability.
3. Stock Market Response:
- The stock market often responds positively to the first rate cut by central banks, which typically accompanies the transition from an inverted to a positive yield curve. Lower interest rates can stimulate borrowing and investment, which can boost corporate profits and stock prices.
- However, the stock market’s reaction can be mixed in the longer term. It may initially rally on the news of rate cuts, but over time, other economic factors and corporate earnings prospects come into play.
- The stock market is influenced by a complex interplay of factors, including monetary policy, fiscal policy, corporate earnings, global events, and investor sentiment. Therefore, while rate cuts can provide a short-term boost, the overall trajectory of the stock market is influenced by a multitude of factors.
In summary, the shift from an inverted yield curve to a positive yield curve is a crucial transition that can signal improved economic conditions. However, it does not eliminate the possibility of a recession, and the stock market’s response to such changes is multifaceted and influenced by various factors beyond interest rates.
The Federal Reserve
The Federal Reserve continued to play a pivotal role in shaping the U.S. economy in 2023, with dual mandates focusing on maximum employment and price stability, demonstrating commendable progress on both fronts. On the employment side, the final reported unemployment rate for November stood at 3.7%, signaling robust job market conditions – a noteworthy achievement considering that figures below 4% are deemed indicative of a strong employment situation.
Additionally, the Fed’s efforts toward ensuring price stability yielded lower inflation rates, as discussed in the earlier section on inflation. Inflation came down more swiftly than anticipated at the beginning of the year, showcasing the effectiveness of the Fed’s monetary policy.
There was also a notable shift at the Fed as inflation data continued to reign in lower than expected. At the December meeting, Powell began the first outward talks of a potential rate cut in the new year, as the Fed tries to maintain a balance of slowing the economy, but not into a recession. Despite initial hawkish inclinations in 2023, the Fed adopted a more dovish outlook by the end of the year, in response to a robust labor market and disinflation.
We look forward to continuing to monitor the Fed’s adaptability to evolving economic conditions and its commitment to steering the economy towards its mandated objectives of maximum employment and price stability.
Too Many Projected 2024 Rate Cuts?
An excessive expectation of multiple rate cuts by central banks can serve as a red flag for the state of the economy and potentially trigger a decline in equity markets. This anticipation often arises when policymakers resort to frequent rate reductions as a means of stimulating economic growth. Such a scenario implies that the economy may not be performing as well as anticipated, leading investors to interpret it as an underlying sign of economic weakness.
This anticipation can further erode investor confidence. Investors may perceive the repeated rate cuts as central banks’ acknowledgment of their concerns about the economic outlook. This loss of confidence can, in turn, lead to selling pressure in equity markets, as investors become increasingly risk-averse.
Additionally, the impact of rate cuts may diminish over time, particularly when interest rates are already at historically low levels. Further rate reductions may offer diminishing returns in terms of stimulating economic activity, causing investors to question the effectiveness of monetary policy alone in supporting growth.
Furthermore, lower interest rates can have mixed effects on different sectors of the economy. While they can boost sectors like housing and consumer spending, they can negatively impact industries such as banking and insurance that rely on higher interest rates for profitability. This can exert downward pressure on corporate earnings, a critical factor influencing stock prices.
Amidst these concerns, the markets may become more uncertain. Investors typically favor stability and predictability, but excessive expectations of rate cuts can create uncertainty regarding the direction of monetary policy. Such uncertainty can lead to increased market volatility and a lack of confidence in future economic conditions.
In response, some investors may seek alternative investment options if they believe that multiple rate cuts won’t yield the desired returns in equities. This reallocation of capital can result in funds flowing out of equity markets into alternative assets like bonds or safe-haven investments such as gold. In conclusion, while rate cuts aim to stimulate economic activity, an abundance of expected cuts can have adverse effects on equity markets, signaling economic weakness, reducing investor confidence, and fostering uncertainty. Monitoring central bank policies and the broader economic context is essential for informed investment decisions in such situations.
Corporate Earnings
Q3 & Full Year 2023 Earnings
In Q3 and the overall fiscal year of 2023, earnings in the S&P 500 generally surpassed expectations but were not especially bullish across the index. Q3 by itself did mark an improvement with a more than 5% increase from the previous year’s earnings across the S&P, the first quarter of annual earnings growth since Q3 2022. While sales across the S&P 500 also demonstrated growth, the increase was not as pronounced as earnings, with Q3 sales rising by +2.3% – slower than inflation.
Among sectors in Q3, consumer discretionary emerged as the top performer, boasting an impressive +41.2% increase in earnings from a year ago. Conversely, the energy sector experienced the most substantial decline, with an annual earnings contraction of -36.1%.
As Q4 traditionally exhibits stronger performance across sectors due to seasonality reasons, the outlook for the year-end remains optimistic. Looking at the full year 2023, analysts anticipate the S&P 500 to report modest earnings growth of less than +1%, accompanied by a revenue growth of +2.3%.
Sector-wise for 2023, analysts expect that eight sectors expected to report year-over-year growth in earnings, led by Consumer Discretionary and Communication Services. In contrast, they expect that three sectors, Energy, Materials, and Health Care will experience a year-over-year decline in earnings. We look forward to getting more data from corporations as January kicks off Q4 earnings season.
Geopolitical Events
China Slowdown
Contrary to expectations of rapid growth following the pandemic lockdowns, China witnessed a slowdown in its anticipated economic expansion this year. Grappling with challenges such as a property crisis, subdued spending, and elevated youth unemployment, most economists predicted that the world’s second-largest economy will manage to reach its official growth target of approximately 5% for the year, but this falls short of expectations and of the pre-pandemic decade’s average annual growth rate of 6% or more. As 2024 approaches, there is a growing realization that the trajectory of China’s economic performance may be entering a phase of moderation, prompting a reevaluation of expectations for the coming years.
Israel & Hamas Conflict
The ongoing conflict between Israel and Hamas escalated on October 7th, 2023, when Hamas initiated a series of attacks on Israel, marking the first invasion since 1948. The conflict has persisted, causing significant civilian suffering, and there is concern that it may continue into the new year.
The conflict’s potential to expand is heightened by escalating Houthi attacks on cargo ships in the Red Sea, raising fears of a broader Middle East entanglement. At least 17 attacks on vessels believed to be linked to Israel or its allies have occurred, with the recent death of 10 militants in a confrontation involving US Navy helicopters, marking a potential new phase in the crisis.
We will continue to monitor these situations as we aim to mitigate geopolitical risk.
Summary
The fourth quarter of 2023 brought excellent results for both stocks and bonds, contributing to an overall positive year for financial markets and the economy, surpassing many economists and analysts’ expectations. Notably, inflation made significant strides toward the Federal Reserve’s 2% target, prompting indications that the Fed’s cycle of interest rate hikes has likely concluded.
The last quarter also witnessed a decline in interest rates, reinforcing positive economic sentiments and a bond market rally. While corporate earnings are performing better than expected, there may be a lack of extraordinary growth in Q4, as we wrap up 2023’s earnings in the coming month or two. Additionally, global geopolitical risks persist, with specific concerns in the Middle East, adding a layer of unknowns to the overall economic landscape.
We deeply appreciate the ability to monitor market conditions as we take tactical and strategic views on the economy in this interesting economic landscape.
The information contained herein is general in nature. It does not take into account your particular investment objectives, financial situation, or needs. It is provided for illustrative or informational purposes only, and should not be construed as advice. Our advisors can meet with you to discuss your retirement plan.
Ready to Take The Next Step?
For more information about any of our products and services, schedule a meeting today or register to attend a seminar.